The Gridded Population of the World, Version 4 (GPWv4): Population Density, Revision 11 consists of estimates of human population density (number of persons per square kilometer) based on counts consistent with national censuses and population registers, for the years 2000. A proportional allocation gridding algorithm, utilizing approximately 13.5 million national and sub-national administrative units, was used to assign population counts to 30 arc-second grid cells.
The Gridded Population of the World, Version 4 (GPWv4): Population Density, Revision 11 consists of estimates of human population density (number of persons per square kilometer) based on counts consistent with national censuses and population registers, for the year 2005. A proportional allocation gridding algorithm, utilizing approximately 13.5 million national and sub-national administrative units, was used to assign population counts to 30 arc-second grid cells.
The Gridded Population of the World, Version 4 (GPWv4): Population Density, Revision 11 consists of estimates of human population density (number of persons per square kilometer) based on counts consistent with national censuses and population registers, for the year 2010. A proportional allocation gridding algorithm, utilizing approximately 13.5 million national and sub-national administrative units, was used to assign population counts to 30 arc-second grid cells.
The Gridded Population of the World, Version 4 (GPWv4): Population Density, Revision 11 consists of estimates of human population density (number of persons per square kilometer) based on counts consistent with national censuses and population registers, for the year 2015. A proportional allocation gridding algorithm, utilizing approximately 13.5 million national and sub-national administrative units, was used to assign population counts to 30 arc-second grid cells.
The Gridded Population of the World, Version 4 (GPWv4): Population Density, Revision 11 consists of estimates of human population density (number of persons per square kilometer) based on counts consistent with national censuses and population registers, for the year 2020. A proportional allocation gridding algorithm, utilizing approximately 13.5 million national and sub-national administrative units, was used to assign population counts to 30 arc-second grid cells.
This powerpoint document is for the continuation of the FSM Natural Disasters Timeline in the FSM from 2013-2019. This document is compiled according to all the four states JSAPs. For further information on this, please refer to the State's JSAPs. Created by Department of Environment, Climate Change and Emergency Management- FSM National Government
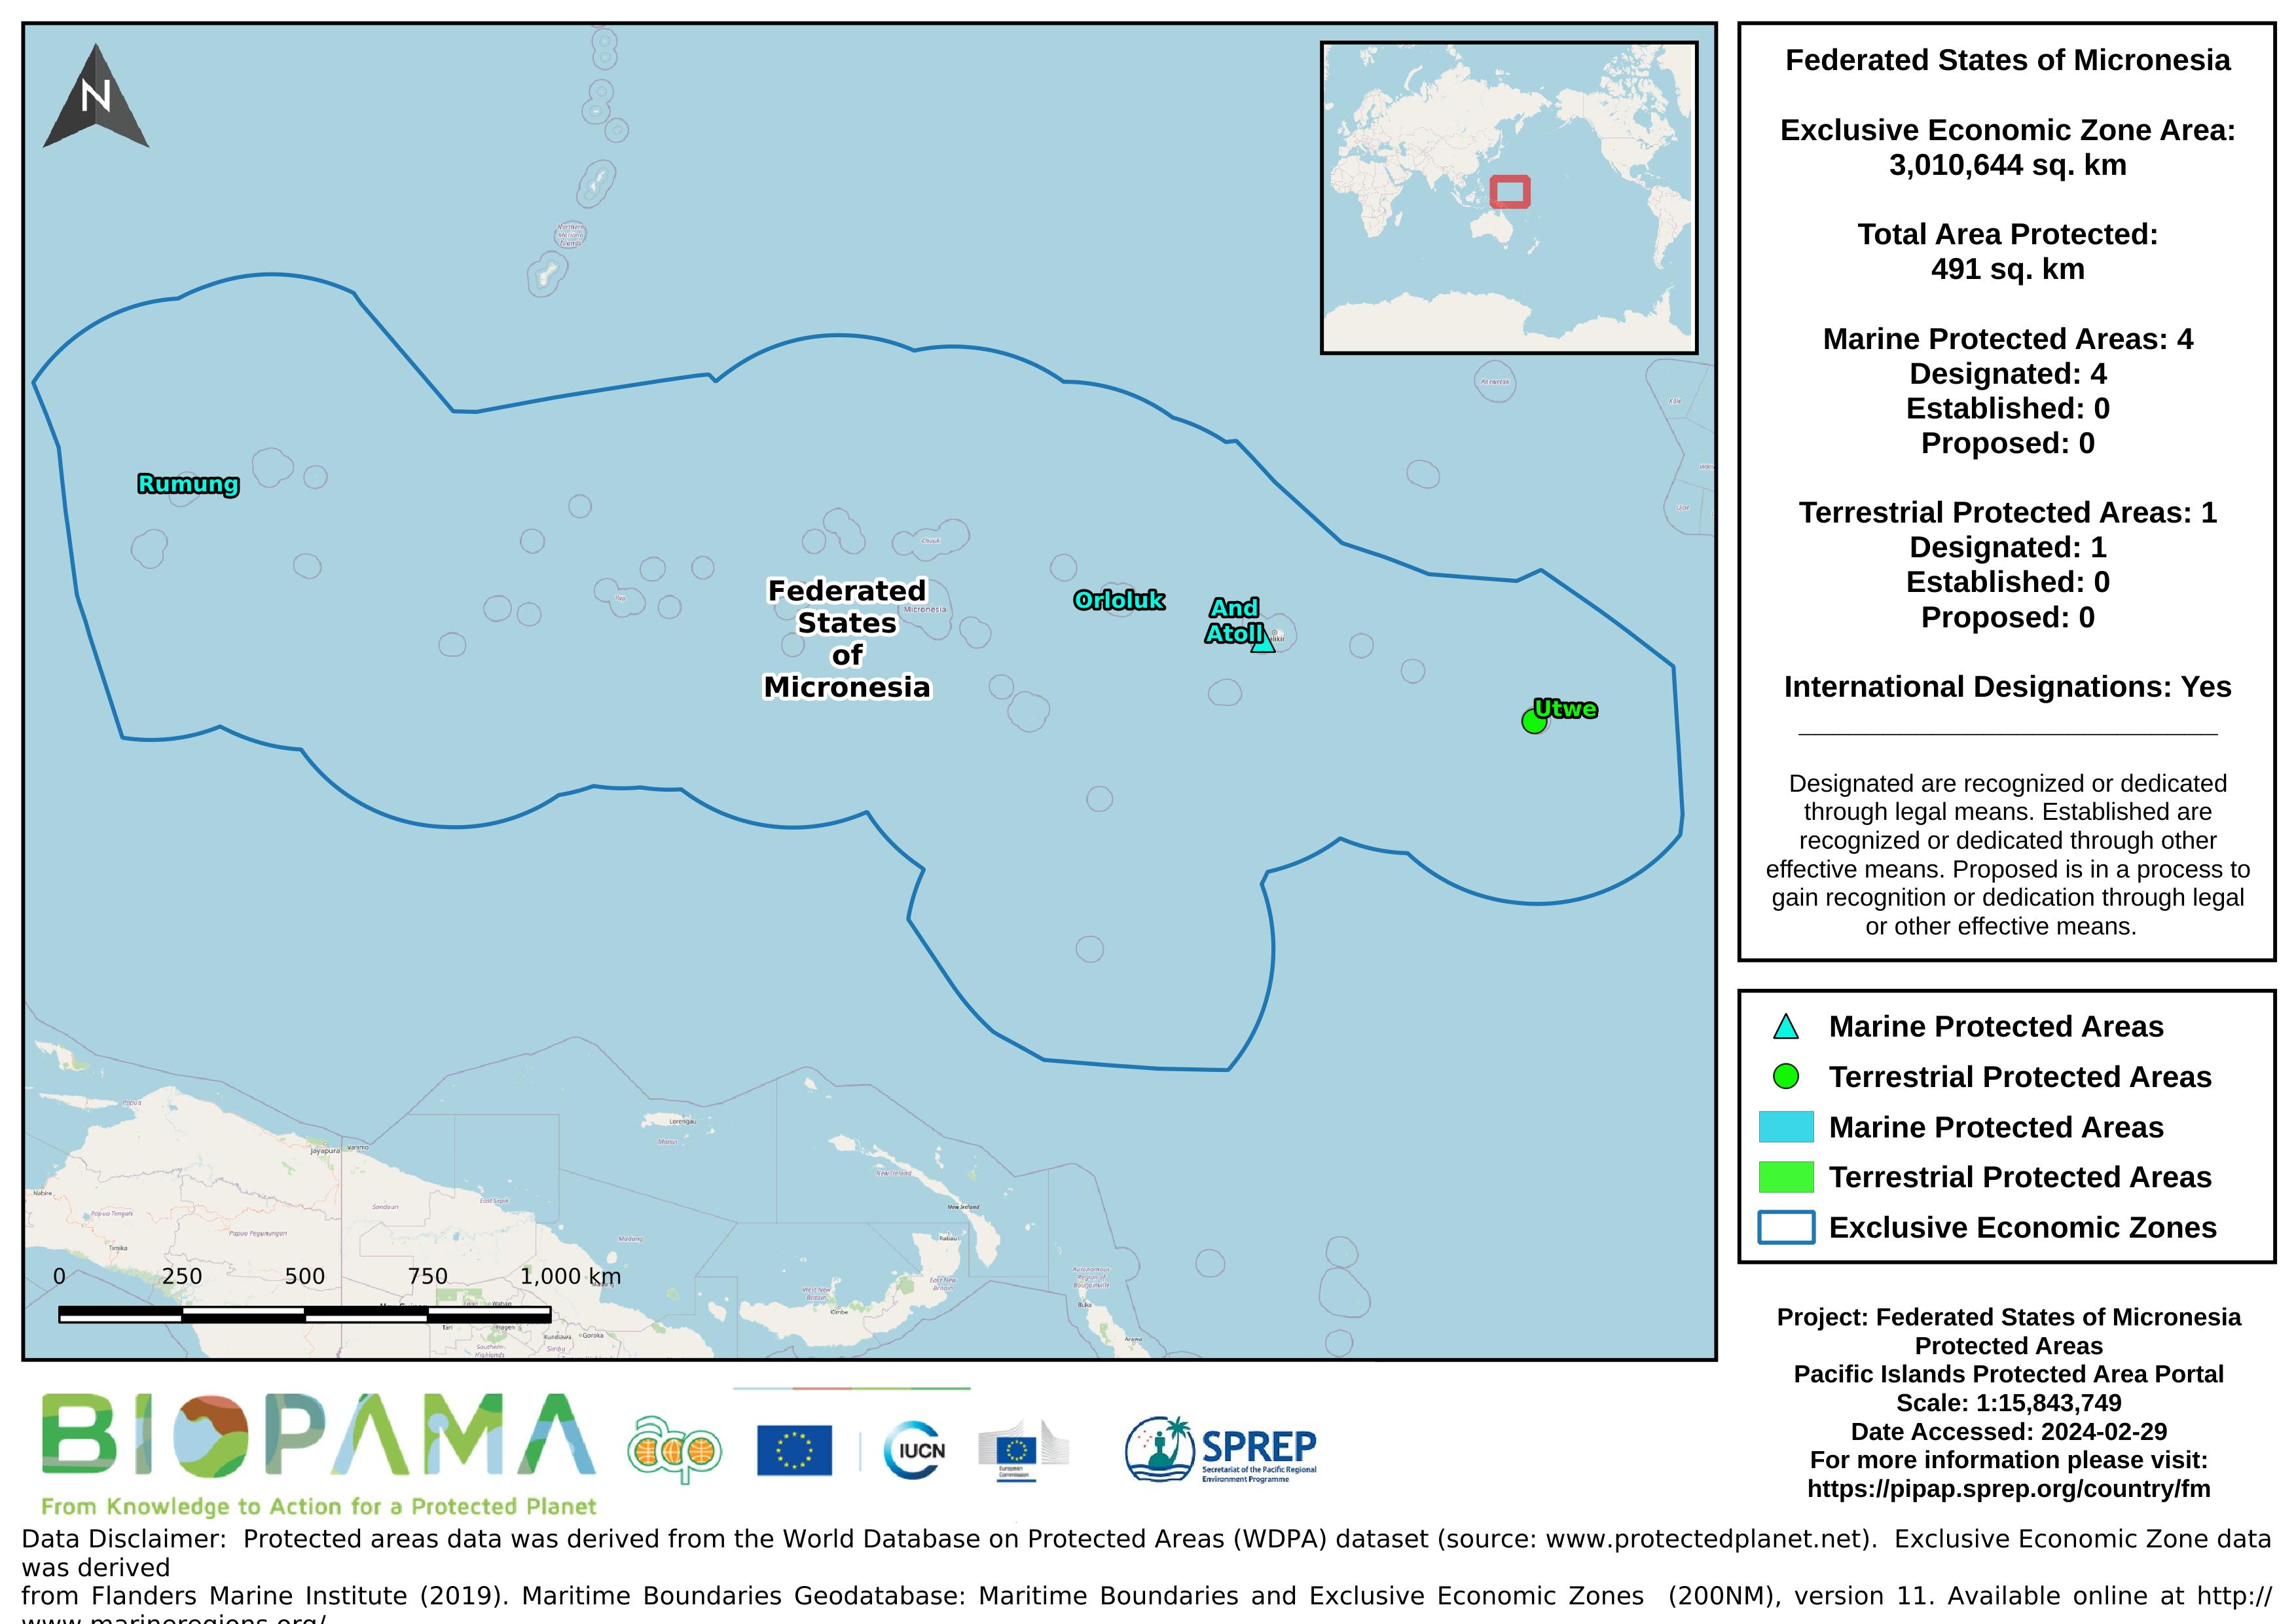
Map of the protected areas in the Federated States of Micronesia with summary statistics on the amount of area under protection, count for each type of protected area (terrestrial or marine), and the count of their designation.
Map of the protected areas for the Chuuk region in the Federated States of Micronesia with summary statistics on the amount of area under protection, count for each type of protected area (terrestrial or marine), and the count of their designation.
Map of the protected areas for Kosrae in the Federated States of Micronesia with country-level summary statistics on the amount of area under protection, count for each type of protected area (terrestrial or marine), and the count of their designation.
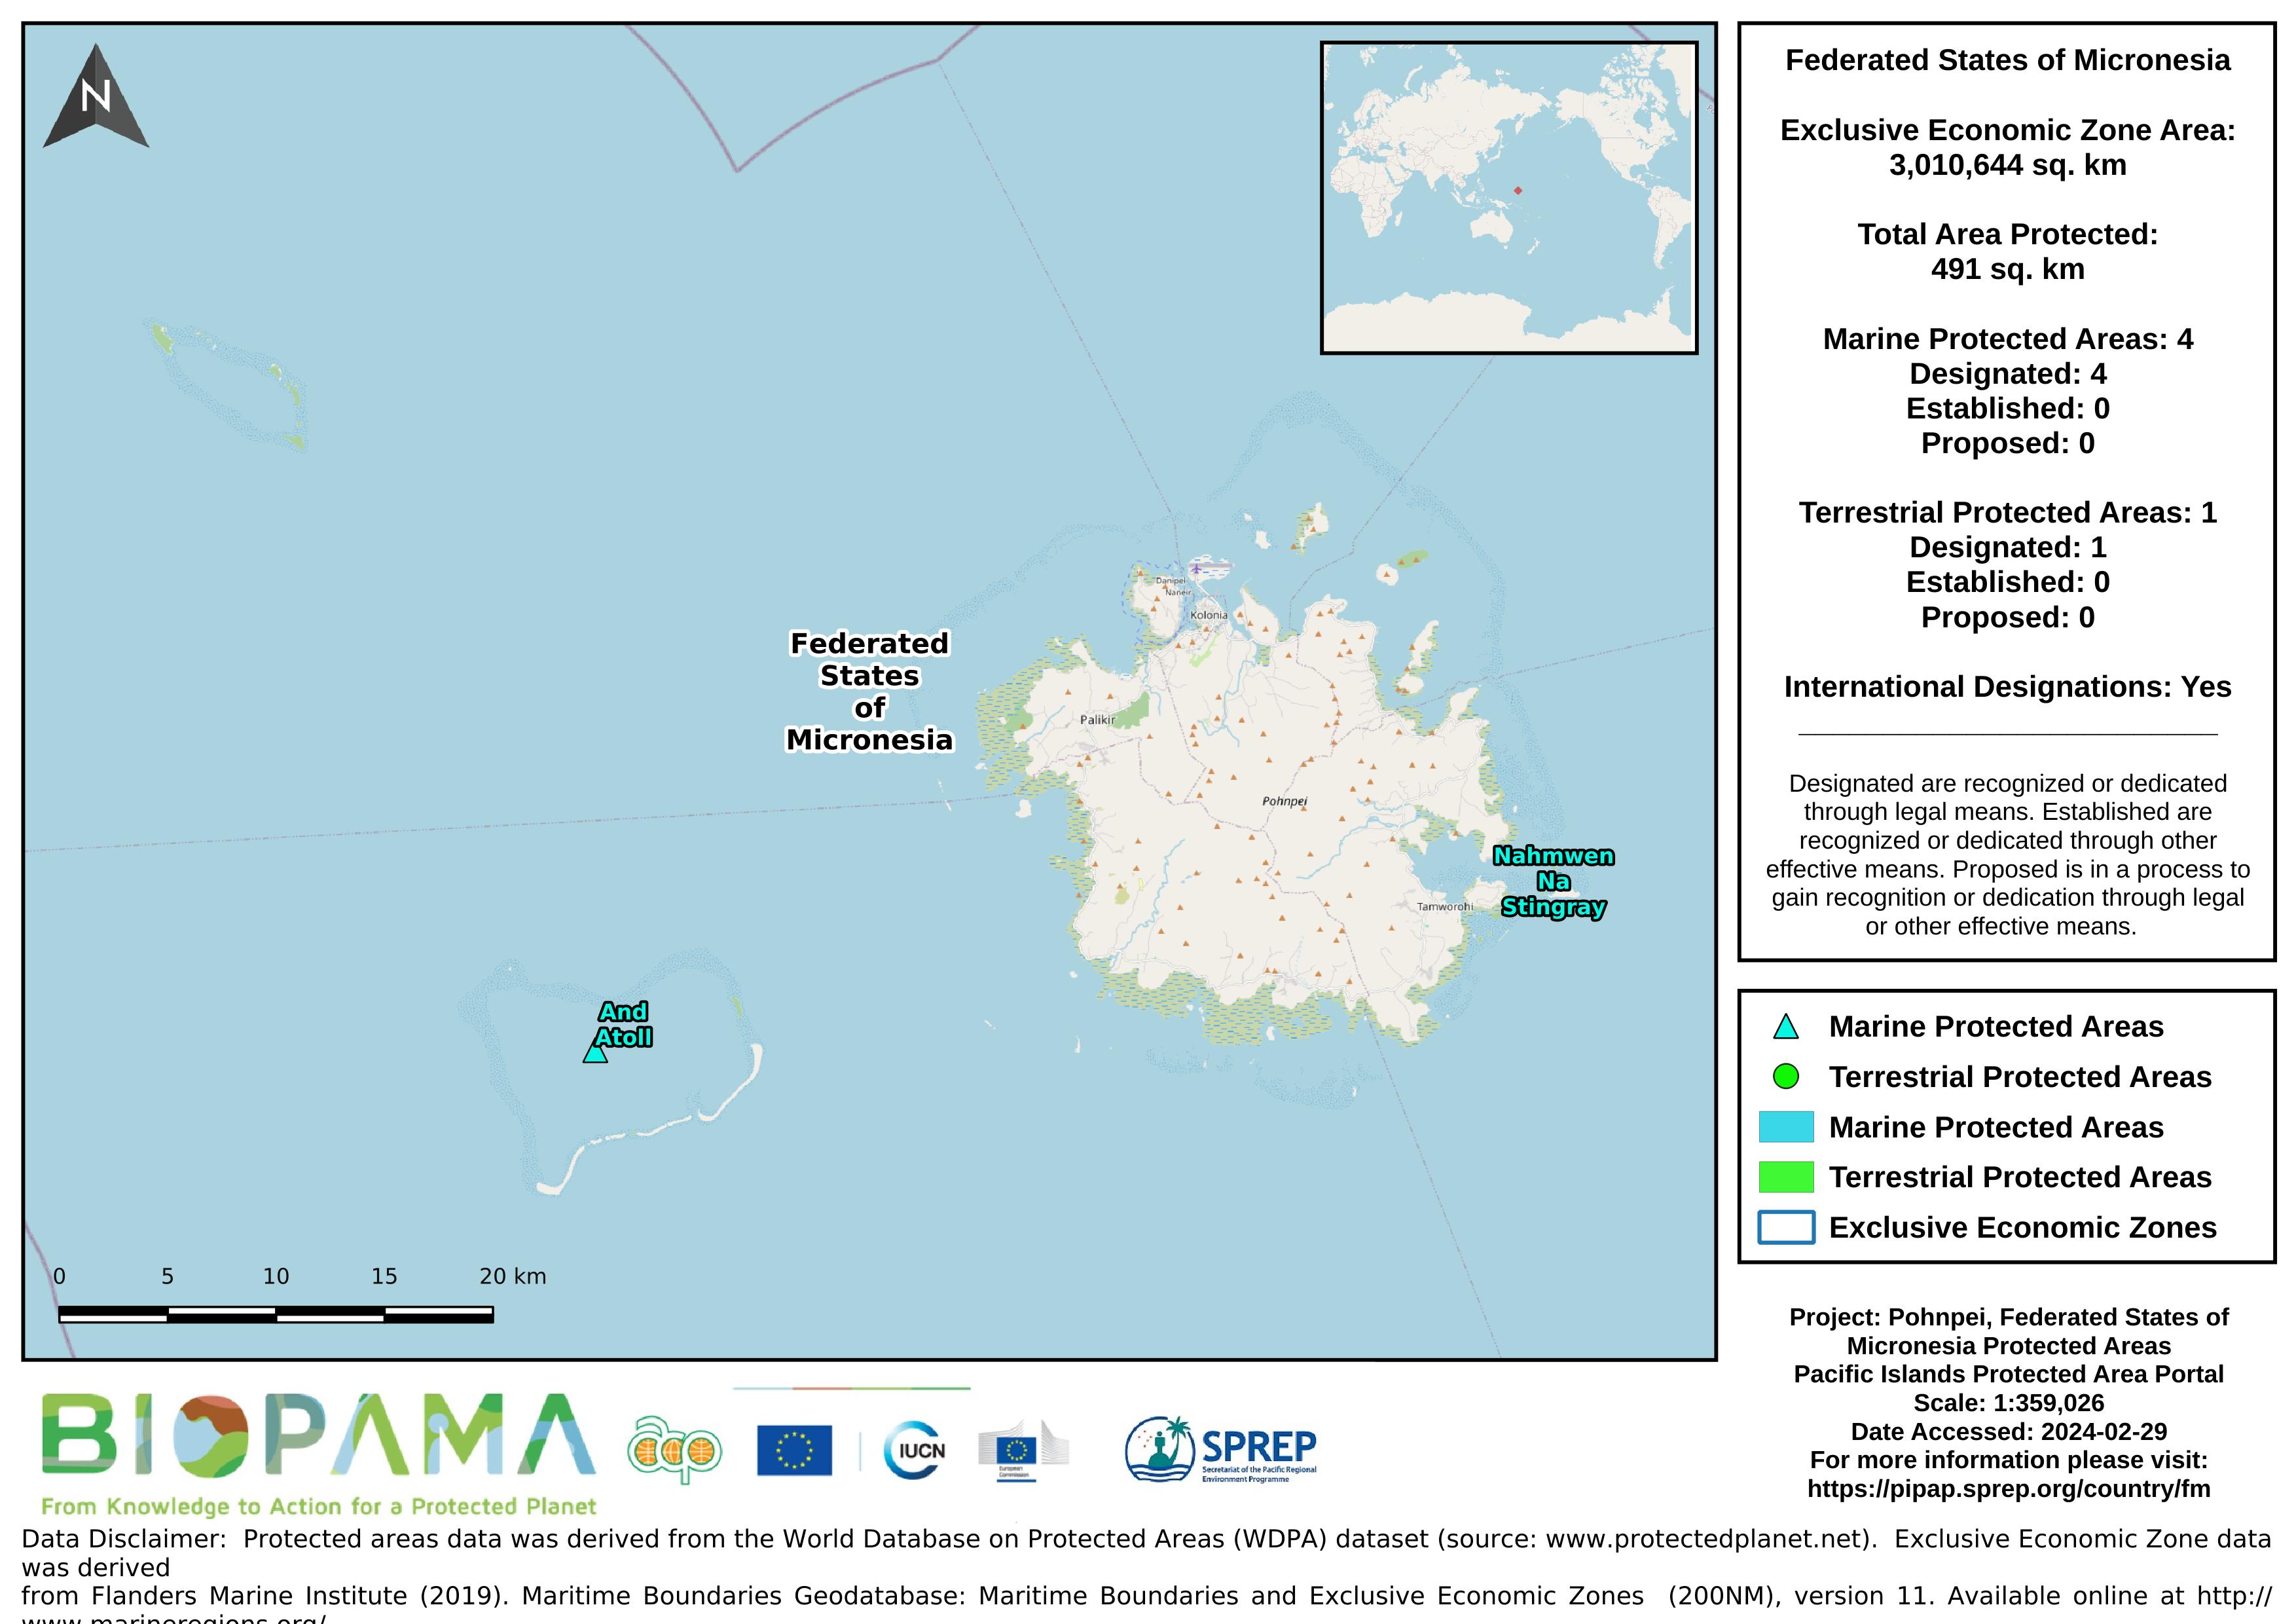
Map of the protected areas for Pohnpei in the Federated States of Micronesia with country-level summary statistics on the amount of area under protection, count for each type of protected area (terrestrial or marine), and the count of their designation.
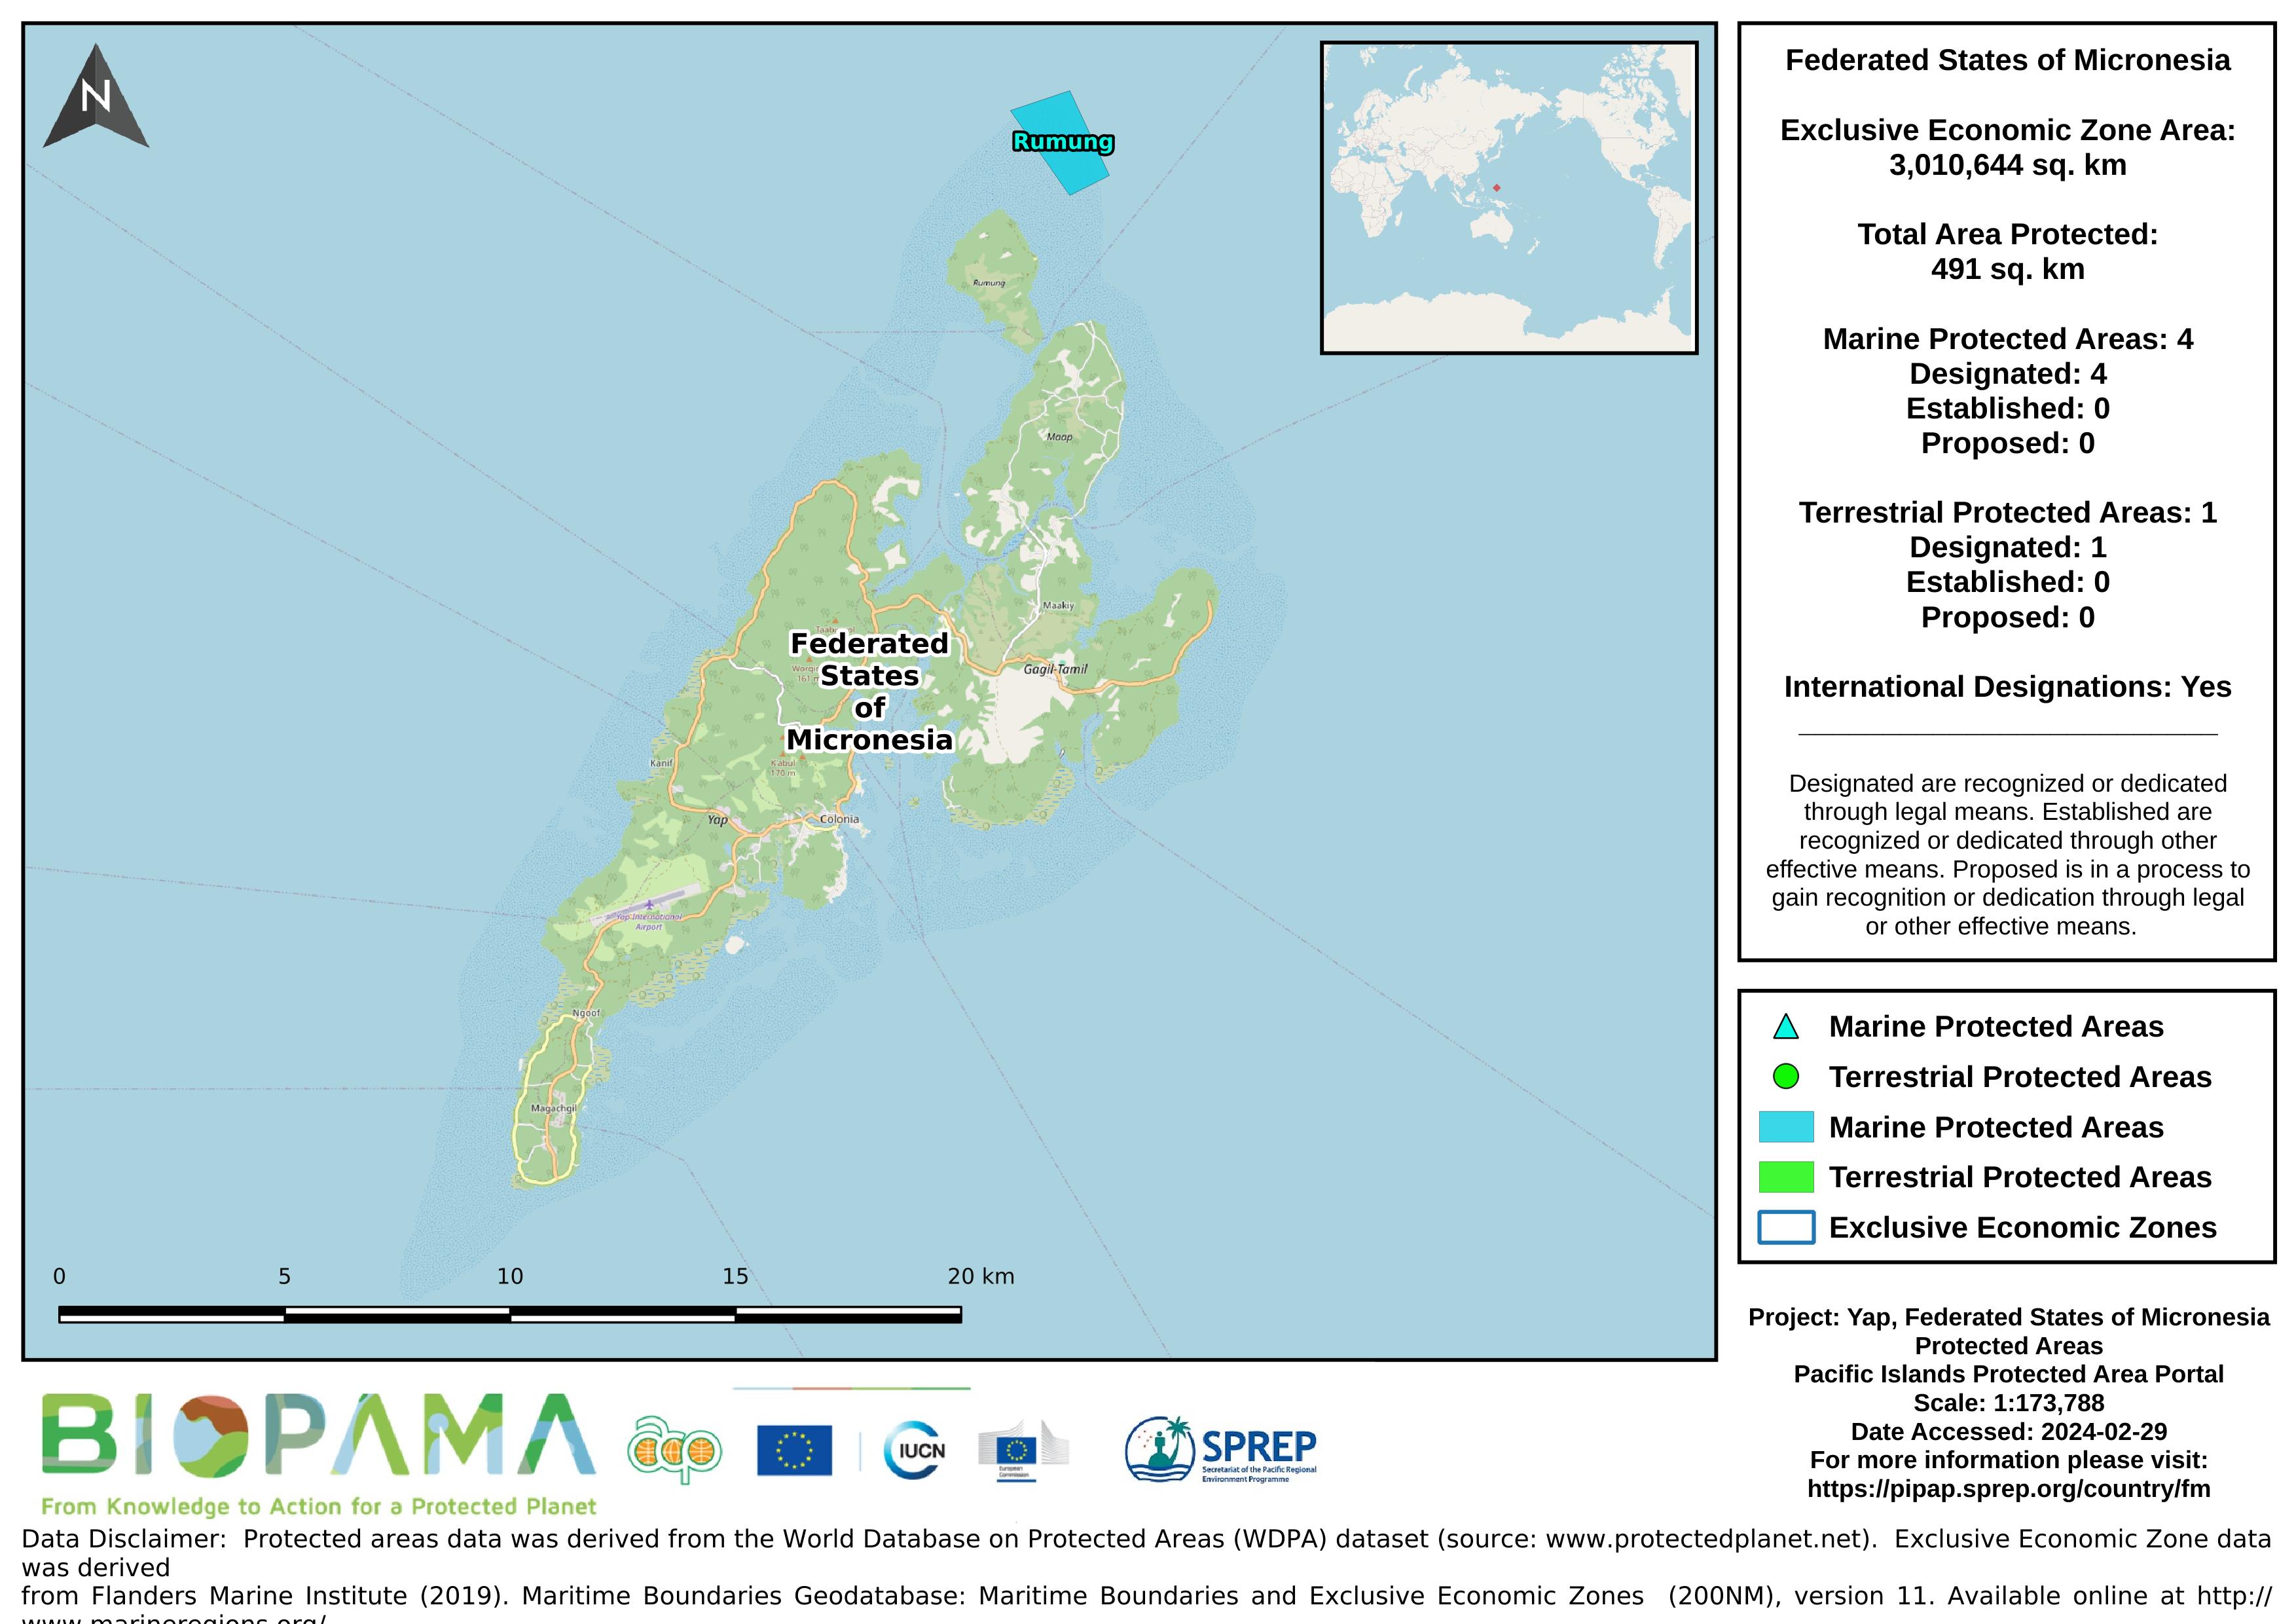
Map of the protected areas for Yap in the Federated States of Micronesia with country-level summary statistics on the amount of area under protection, count for each type of protected area (terrestrial or marine), and the count of their designation.